The problem at the center
We start from the decision you need to make, not from the database you need to buy.
DataFrog connects data, entities and relationships to reveal risks, patterns and opportunities that isolated analysis does not show, and to support decisions with more context.
We start from the decision you need to make, not from the database you need to buy.
Relationships, sources and criteria to support analyses your team can explain and review.
Expertise in enterprise and open source technologies, with selection guided by your scenario.
Customers, companies, transactions and documents are already part of your operation. DataFrog combines graphs, AI and data engineering to turn that information into a connected view of the business.
Your data. More context. We work on the client's data and authorized sources. Our focus is intelligence about relationships, not selling databases.
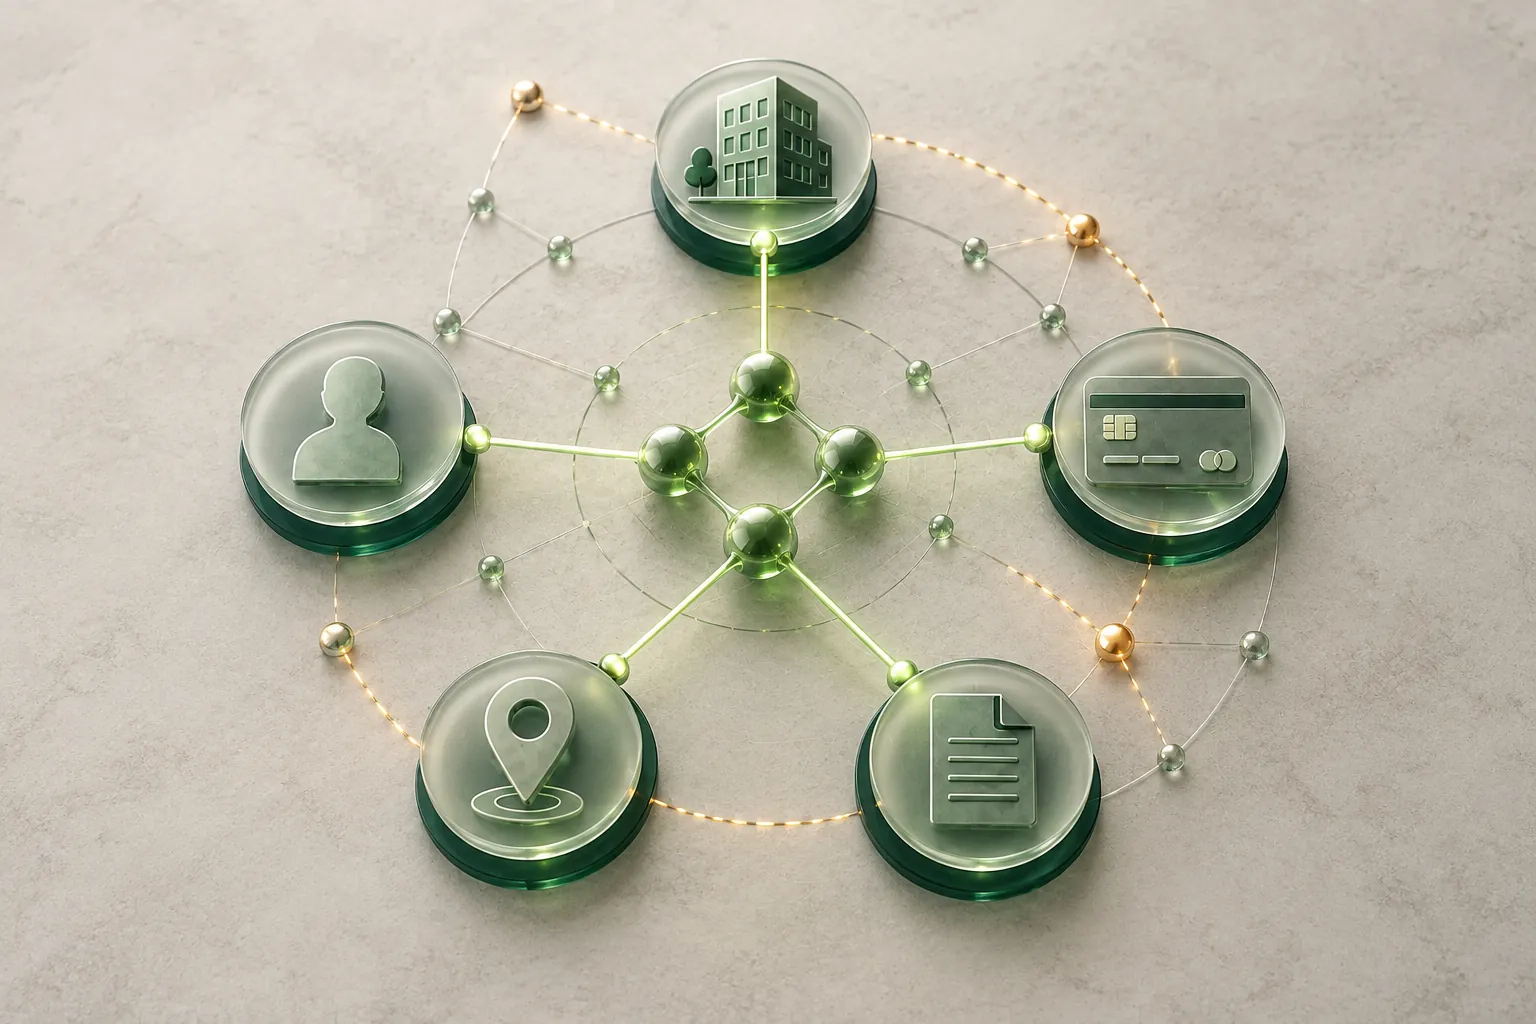
Not every answer needs to be a graph. We design the experience for the question and for whoever will use the analysis, in the format that fits the scope of the solution.
Explore who connects to whom and check the sources that support each link.
Pick your sector and explore how relationships, context and evidence can support your operation's decisions.
Fraud, risk and credit read on the same network of accounts, companies, devices and addresses.
Relationships between accounts, devices and transactions to prioritize investigations.
Economic groups, counterparties and conflicts of interest seen as a network.
Economic groups, assignors and payers in the context of credit analysis.
Our expertise combines enterprise graph technologies, open source ecosystems, analytics and AI. Specialized curation turns business requirements into a well-grounded architecture choice.

Assessment of support, security, integration, availability and scale requirements.
Selection by maturity, license, total cost, operations and fit for the use case.
Volume, latency, queries, budget and team capacity guide the recommendation.
Graphs, maps, tables, dashboards or AI, according to the question and the scope of the solution.
The recommendation is grounded and validated in your context. Requirements, total cost and operations guide the choice of components.
In a free 2-hour diagnosis, we organize the challenge, the sources and the relationships worth investigating. The next step is a proof of value with a defined scope.